Plugins
Robyn is a versatile and extensible web framework that allows anyone to make plugins over the top of Robyn. Plugins in Robyn allow you to enhance and customize the framework's functionality to suit your specific needs. Here are some noteworthy plugins that can supercharge your Robyn-based projects:
Rate Limit Plugin
- Description: This plugin enables you to implement rate limiting for your Robyn application's routes. It helps prevent abuse, and brute-force attacks and ensures fair usage of your resources.
- GitHub repository: robyn-rate-limits
- Installation:
python -m pip install robyn-rate-limits - Usage:
from robyn import Robyn, Request
from robyn_rate_limits import InMemoryStore
from robyn_rate_limits import RateLimiter

app = Robyn(__file__)
limiter = RateLimiter(store=InMemoryStore, calls_limit=3, limit_ttl=100)

@app.before_request()
def middleware(request: Request):
    return limiter.handle_request(app, request)

@app.get("/")
def h():
    return "Hello, World!"

app.start(port=8080)
In this example, robyn-rate-limits is used to enforce a rate limit of 3 requests per 100-seconds window for specific routes. If a client exceeds this limit, they will receive a "Too many requests" message.
The plugin integrates seamlessly with the Robyn web framework, enhancing the security and stability of your application by preventing excessive requests from a single client.
Robyn Config
-
Description: A CLI companion for bootstrapping and maintaining production-ready Robyn applications. It can create new projects, add business entities, scaffold an admin panel, and wire an observability stack into an existing app.
-
GitHub repository: robyn-config
-
Installation:
python -m pip install robyn-configOr as a Robyn optional dependency:
python -m pip install robyn[robyn-config] -
Python support: Python 3.11 or newer.
Create a Project
# DDD + SQLAlchemy with uv dependency locking (default)
robyn-config create my-service --design ddd --orm sqlalchemy ./my-service

# MVC + Tortoise ORM with poetry dependency locking
robyn-config create newsletter --design mvc --orm tortoise --package-manager poetry ./newsletter

# Interactive project setup
robyn-config create -i
robyn-config create gives you explicit choices for the two main architecture branches:
- DDD for domain, application, infrastructure, and presentation layers.
- MVC for views, repositories, models, and URL routing.
It also lets you choose the database layer and package manager:
- SQLAlchemy or Tortoise ORM for persistence.
- uv by default, or poetry with
--package-manager poetry.
Add Business Logic
Inside a generated project, add a new entity and let robyn-config place the files in the correct design-specific layers:
cd my-service
robyn-config add product
This generates the model, repository, route/controller code, and application wiring for the selected architecture. Custom generation paths can be configured in [tool.robyn-config.add] inside the generated project's pyproject.toml.
Add an Admin Panel
cd my-service
robyn-config adminpanel

# Override the default admin/admin bootstrap credentials
robyn-config adminpanel --username superadmin --password super-secret-password ./my-service
The admin panel scaffolding adds an ORM-aware admin module, registers it with the application, discovers available project models, and exposes CRUD views for those models.
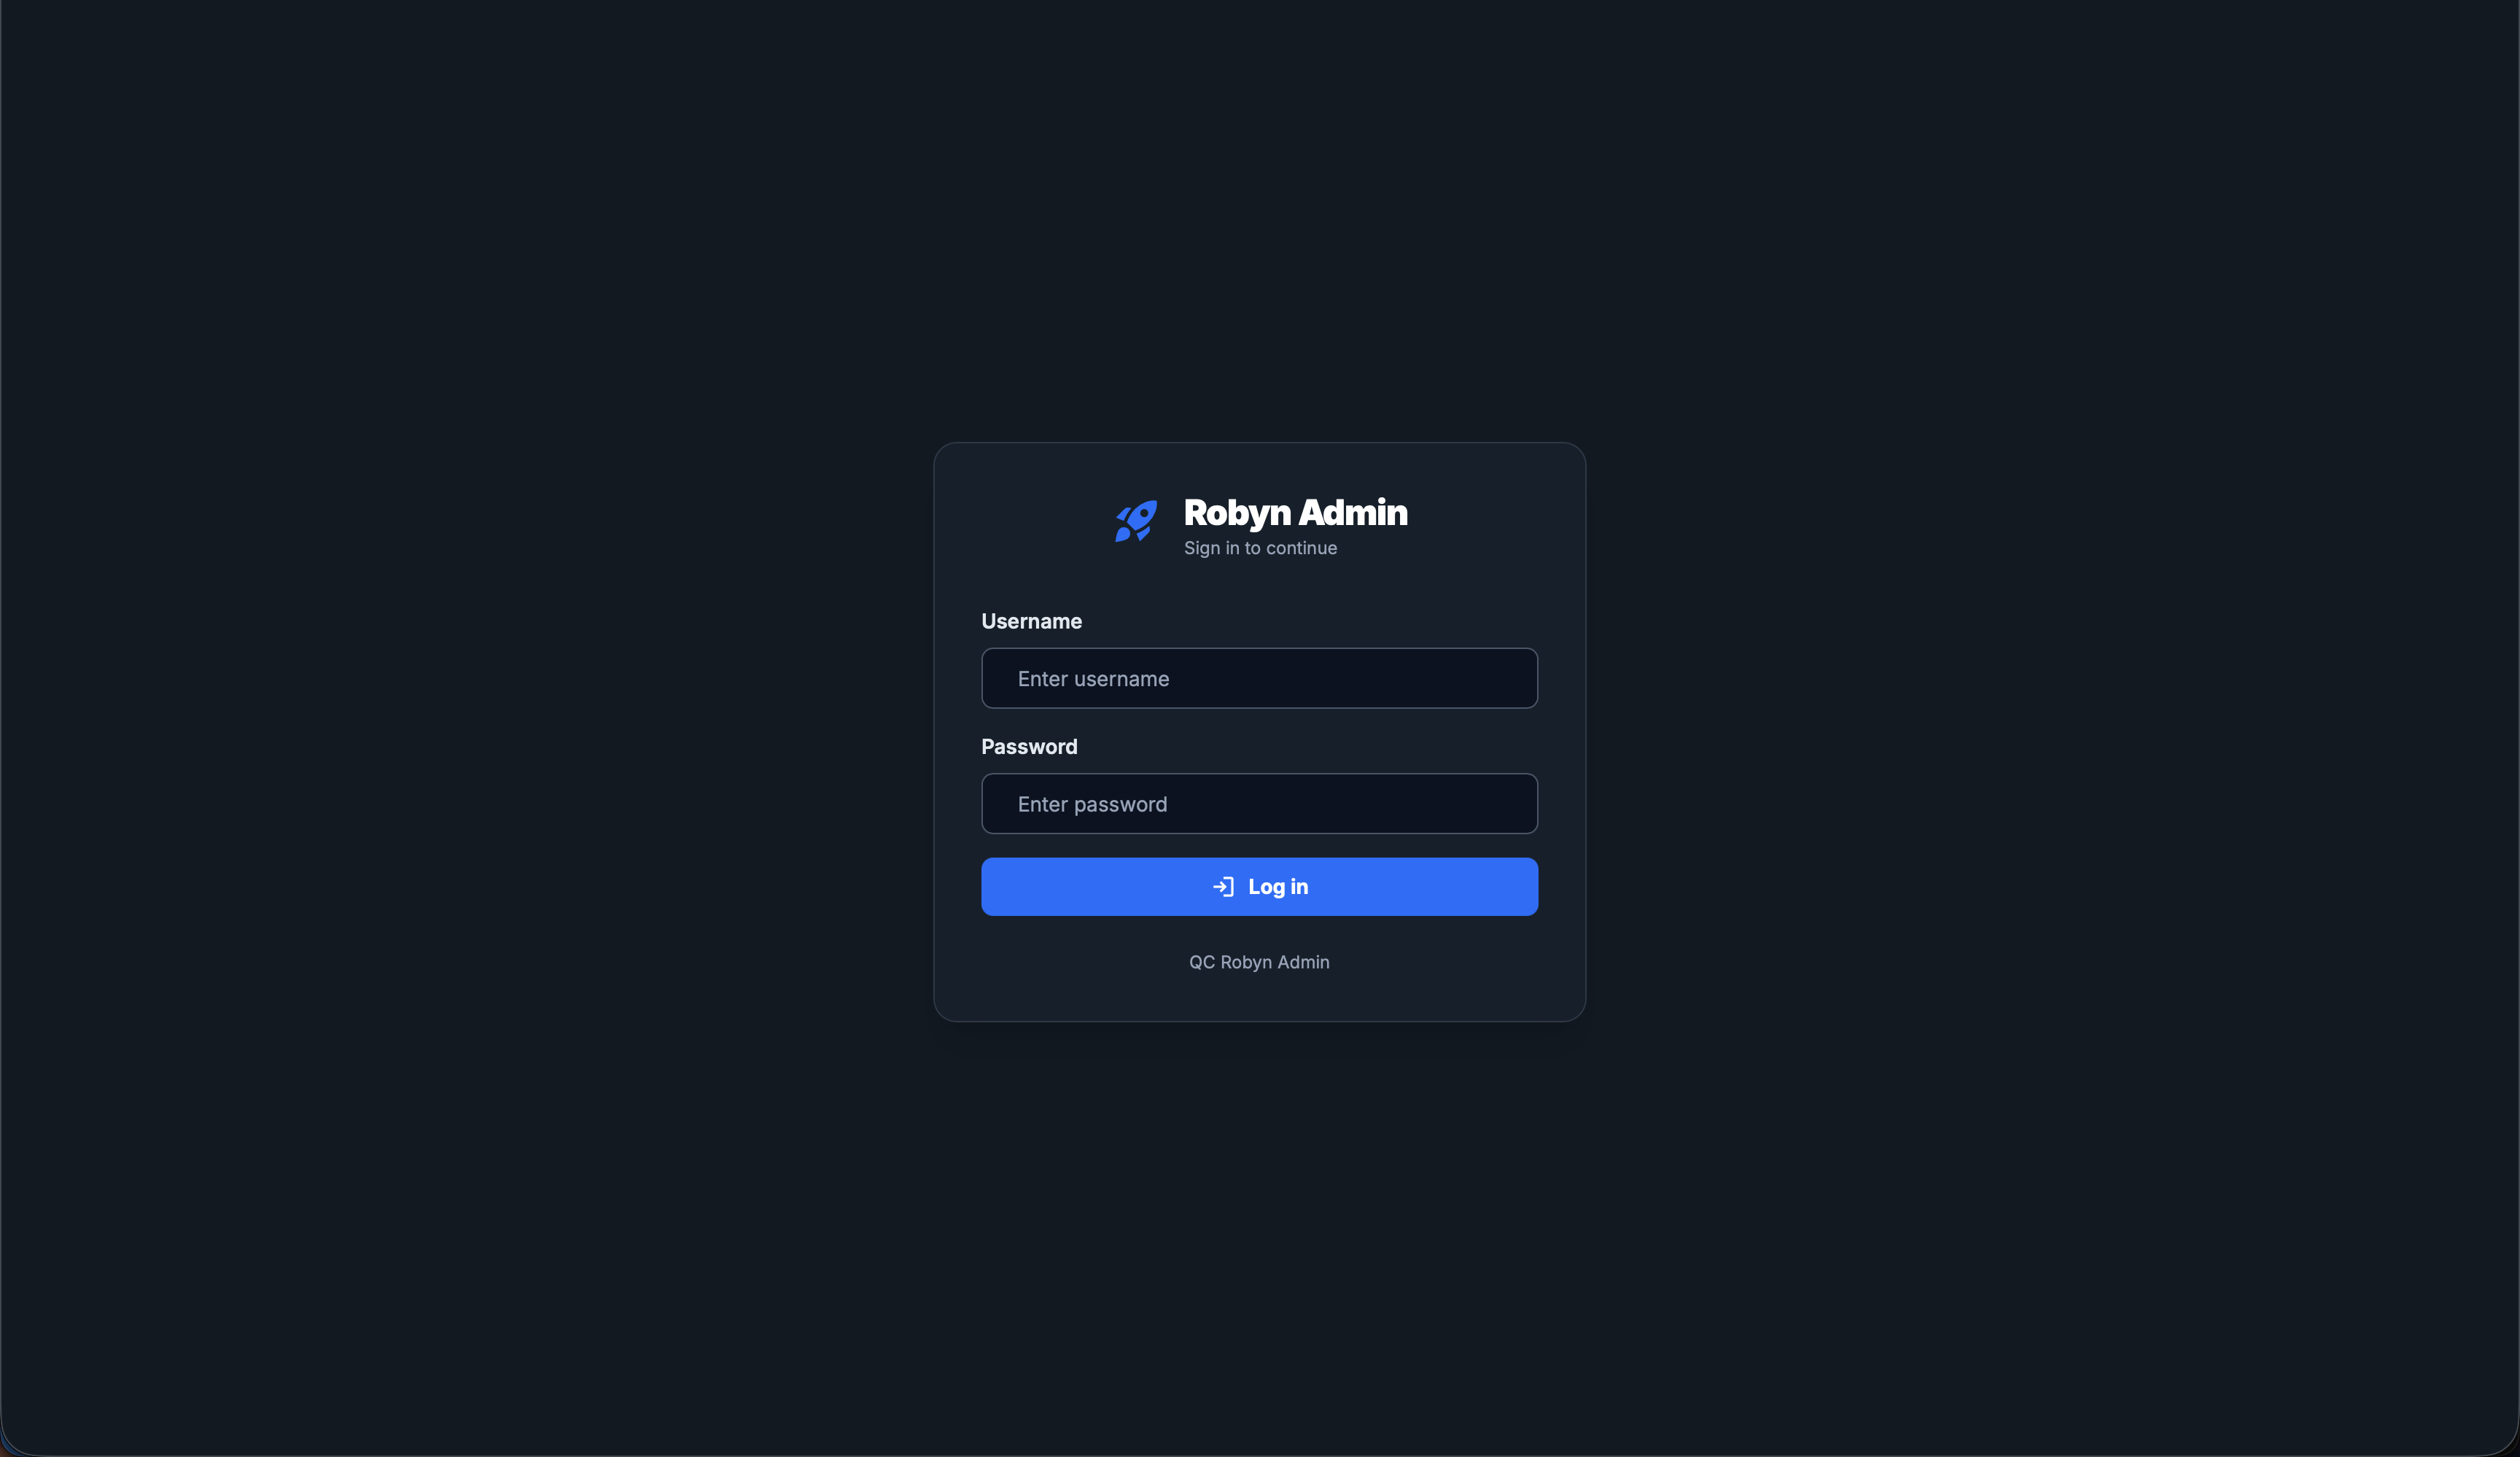
Admin login
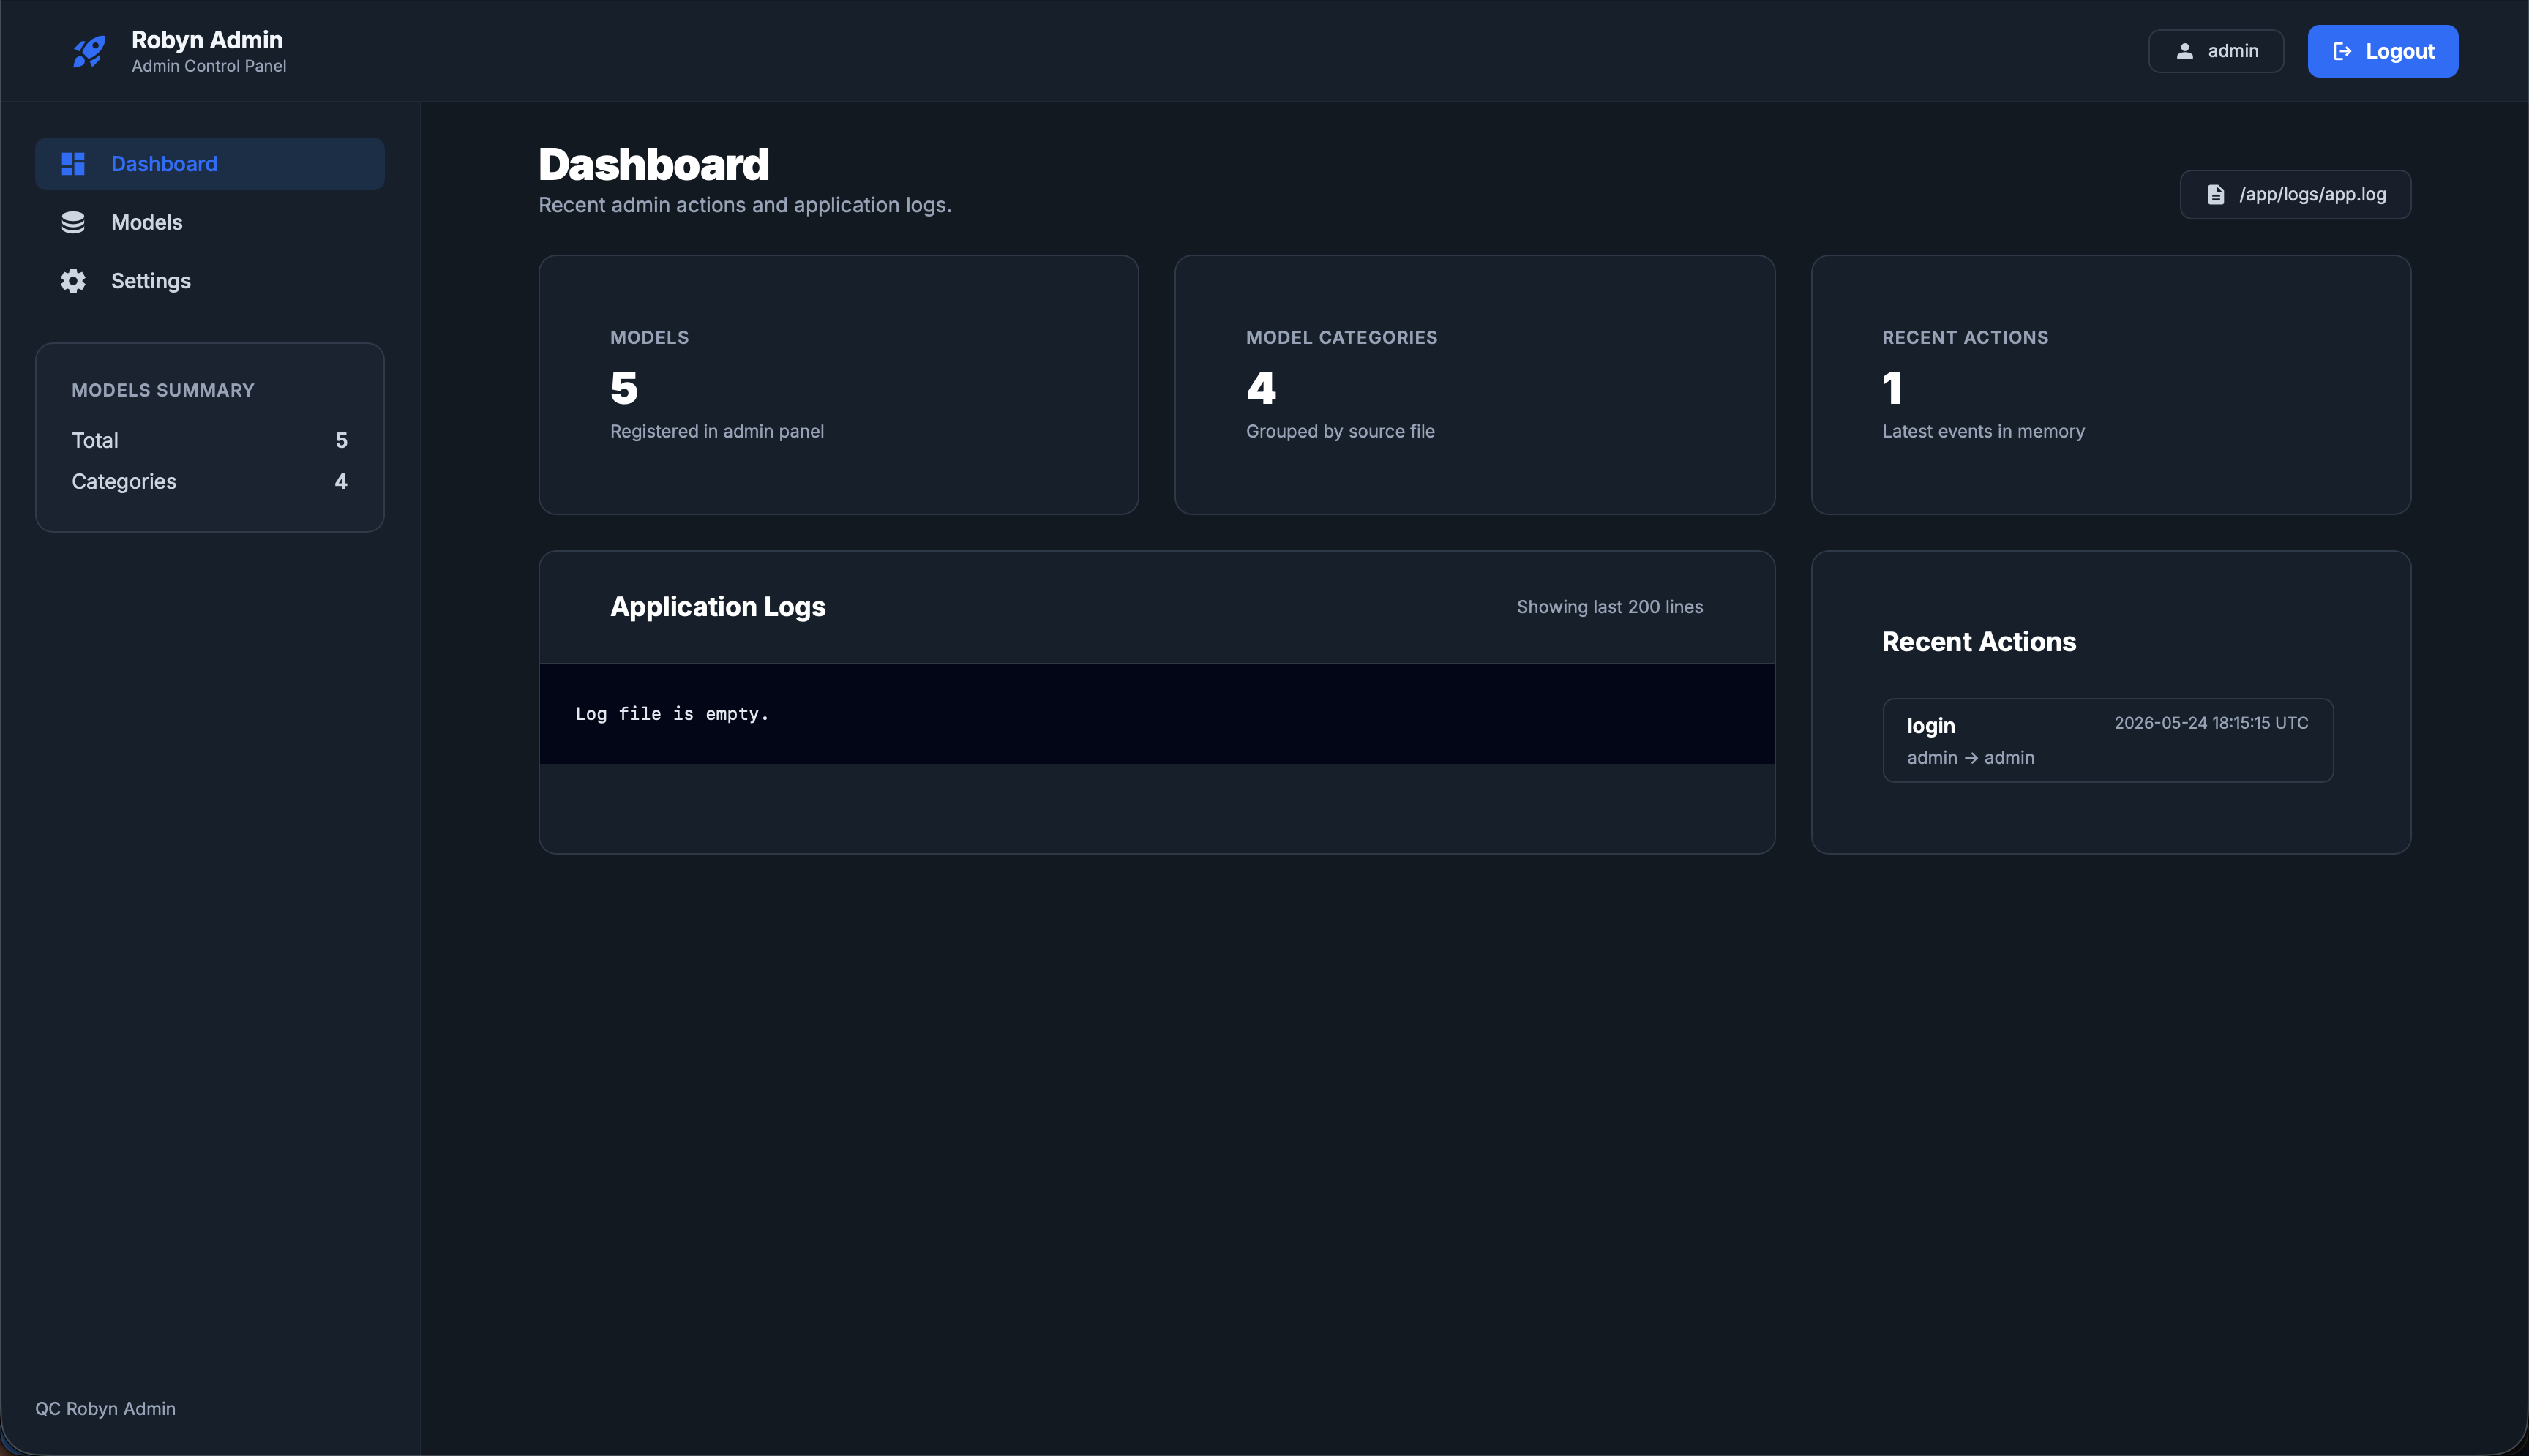
Admin dashboard
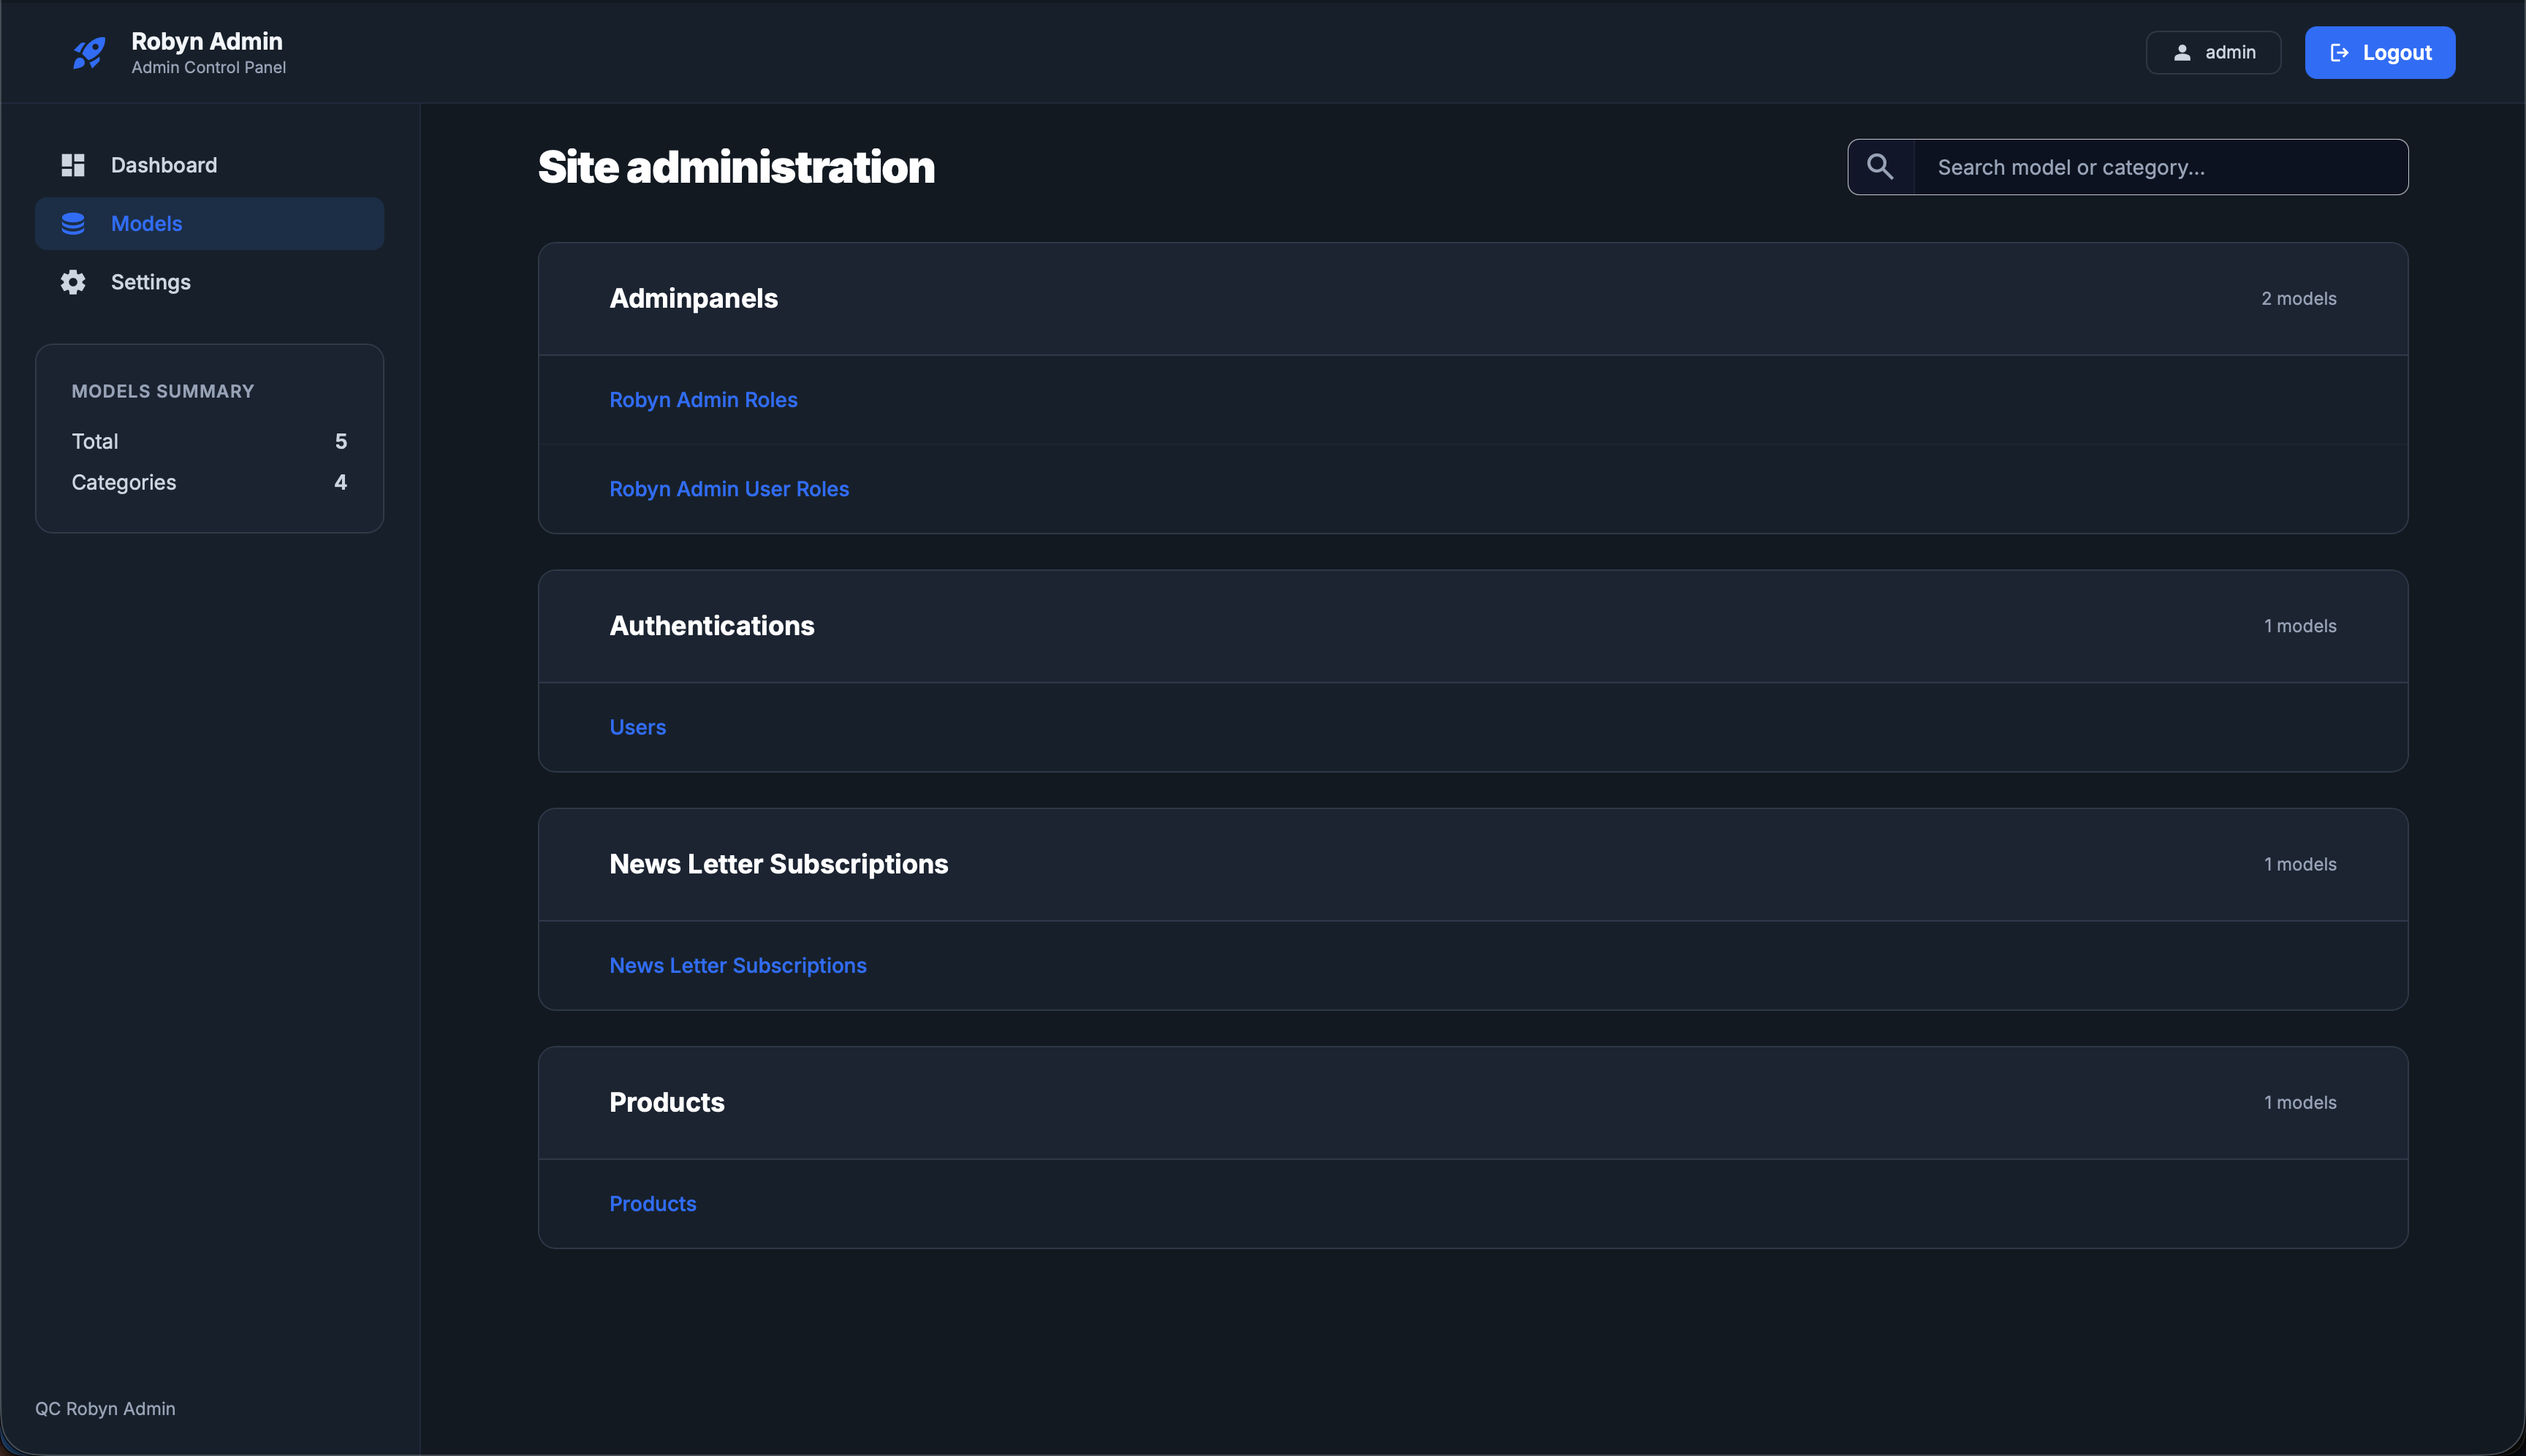
Model listing
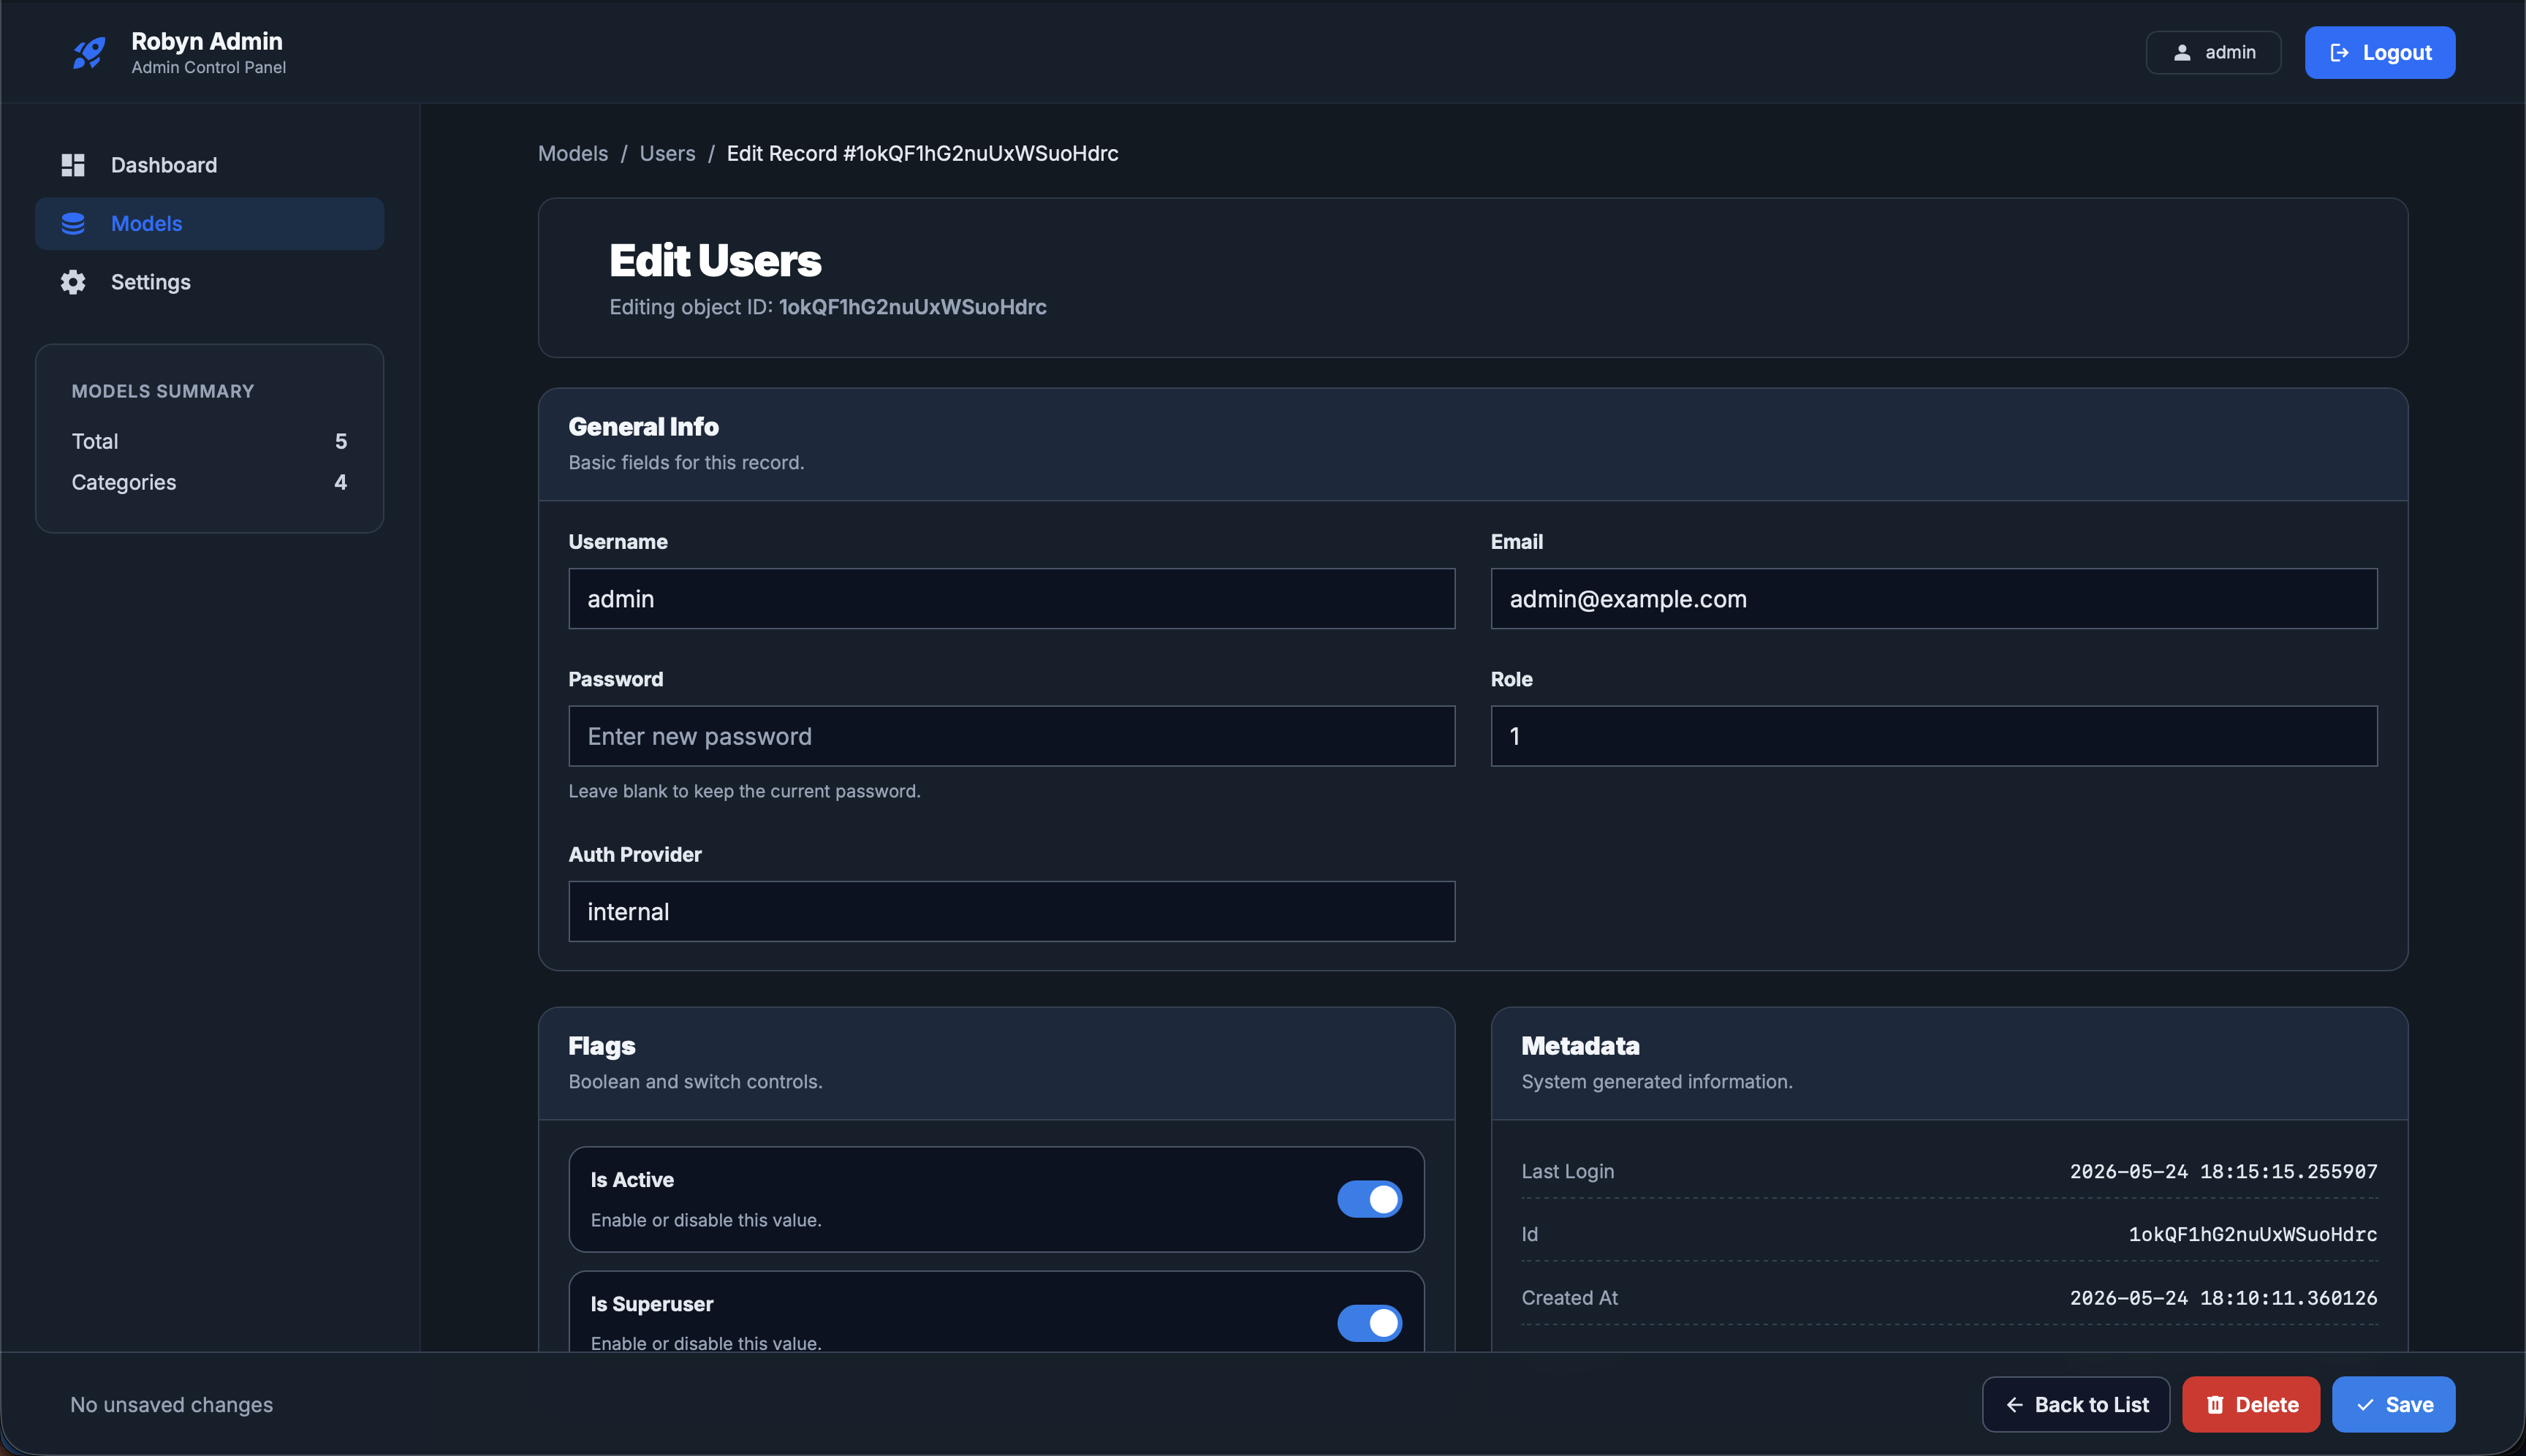
Model editor
Add Monitoring
cd my-service
robyn-config monitoring

# Start the application stack and observability stack
docker compose up -d
docker compose -f docker-compose.monitoring.yml up -d
The monitoring command adds a /metrics endpoint, installs prometheus-client, and provisions Docker Compose assets for Grafana Alloy, Loki, Prometheus, and Grafana. Grafana is available at http://localhost:3000 with dashboards for logs and process metrics.
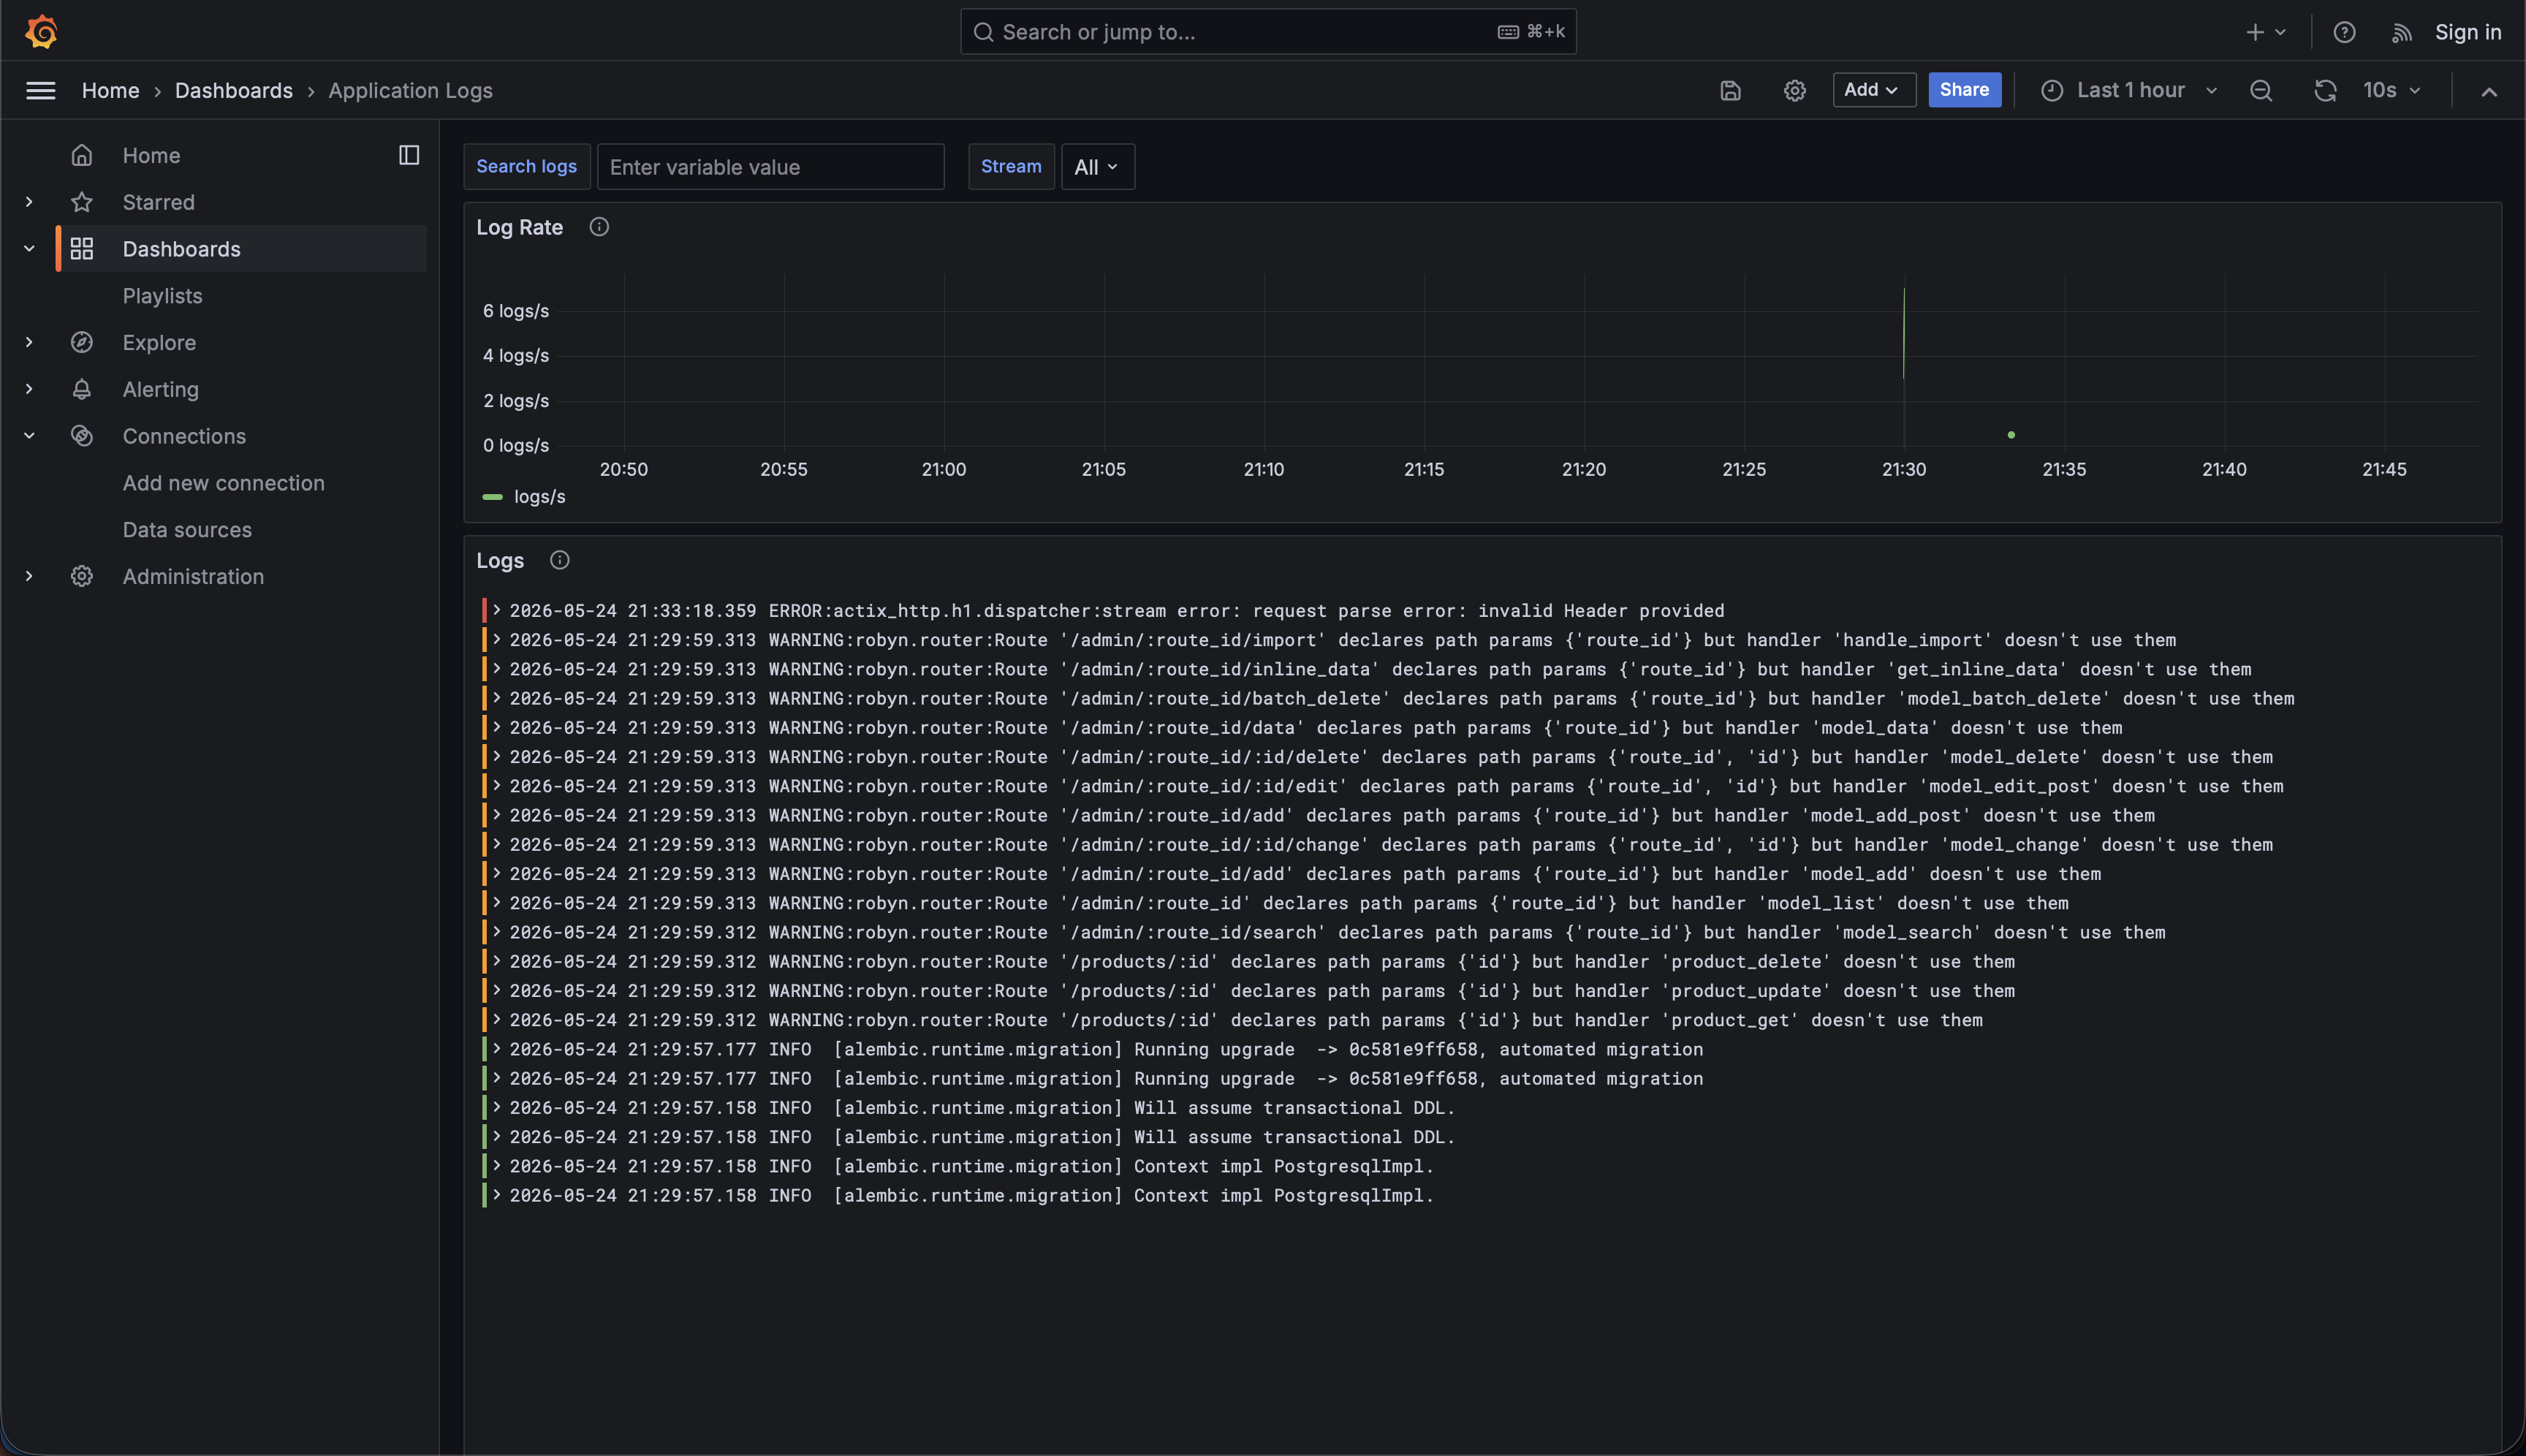
Logs dashboard
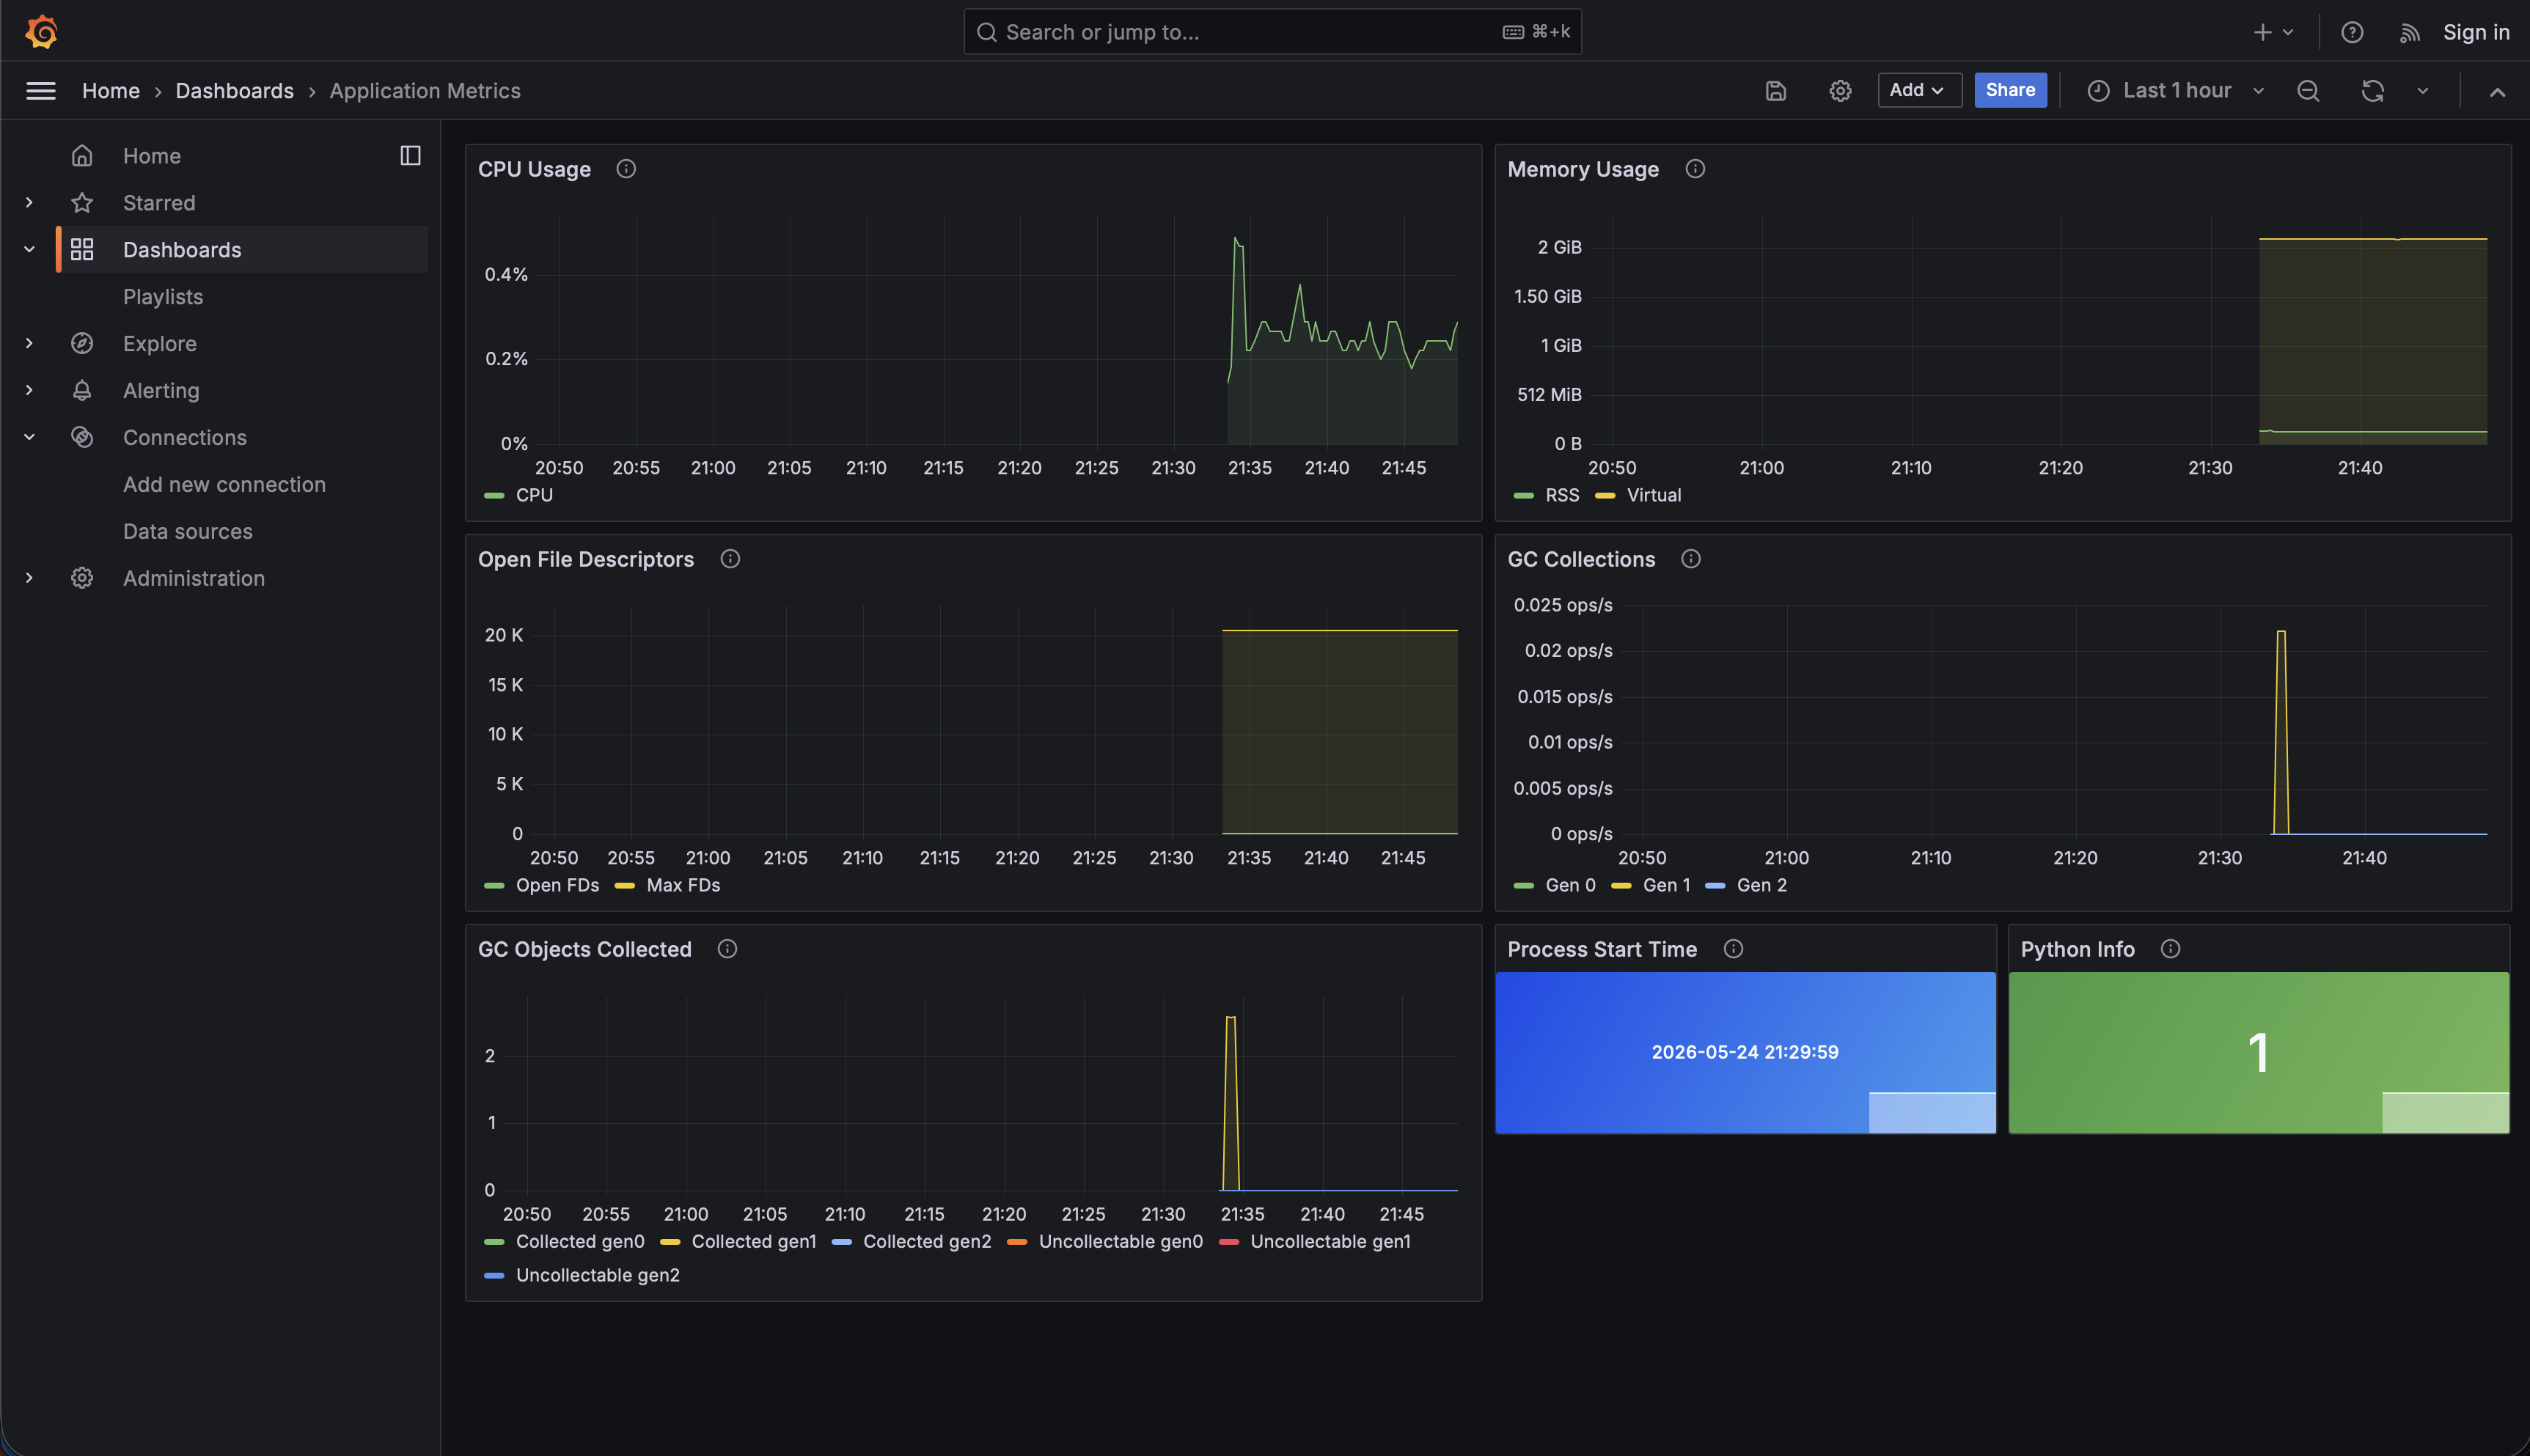
Metrics dashboard
Validate Generated Projects
After generating or modifying a project, run the checks that match the generated package manager:
# uv projects
uv run pytest
uv run ruff check .

# poetry projects
poetry run pytest
poetry run ruff check .
For monitoring, confirm the application exposes Prometheus metrics and that Grafana has data:
curl http://localhost:8000/metrics
curl -I http://localhost:3000
What's next?
After exploring the plugins, Batman wanted to explore the community.So, Robyn pointed him to